Last period was very busy for AgentSlug.com project and it might be important to share some news with you.
Currently, we are working on major changes. Most of them are improvements, but some will affect user experience. We hope it will be much better
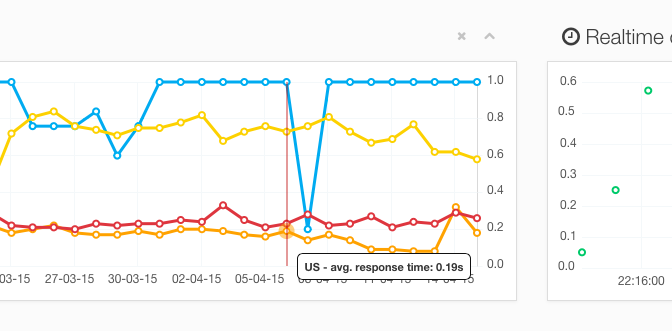
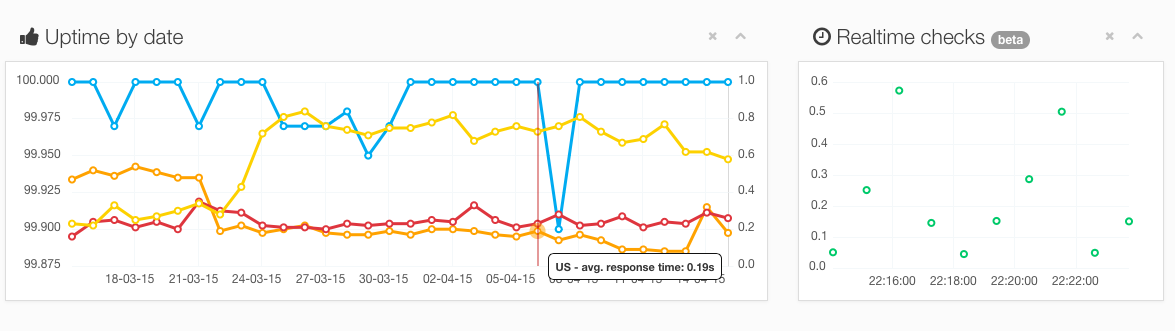
Uptime test statistics data limits
With a first version of AgentSlug.com we didn’t have any restrictions regarding the data storage for each users. We were tiny and it was not an issue to keep the data even for couple of years.
Now however, we are preparing big changes in our infrastructure and to be prepared for them, we need to shrink the database to have it as small as possible.
We decided to introduce a 2 months limit for historical data for all uptime tests we currently maintain.
In the future, there will be an option to avoid this limit, but currently we don’t want to offer it. We did ask some of our users how important it is, we did notify everyone about this change and it seems to be not an issue for anyone at all.
Additionally, we’ve made a copy of all our big database and we will keep it for one month in case of someone didn’t get the message at the right time and could not copy some crucial statistics.
What’s next?
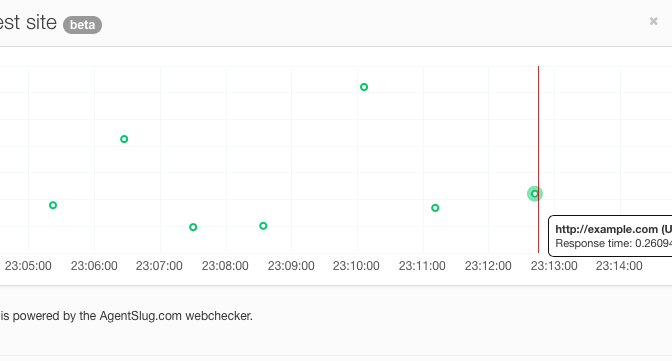
Content Tester
This is the feature we are working on for a long time, but finally it’s reaching a beta version. When it will go public, our service will be much more powerful, able to crawl wholes website looking for all any broken links. Currently it works on our test accounts and we are not ready to publish it yet, but do everything we can to make it available for our customers as soon as possible.
New web application, payment methods and billing system
Along with Content Tester, we will release new and shiny web application, based on React.js and blazing fast. When new app will be ready, additionally to PayPal we will also offer Credit Card payments. Also, we will drop current “points” billing system and offer more understandable system based on € (EUR) currency.
One thing won’t change for sure, we will still charge with explicit permission and with no hidden costs. Free tier will be available as well, so if you are testing your website for free, nothing will change for you in this matter.
If you have any doubts or questions regarding future changes, feel free to contact us any time.
Best wishes!


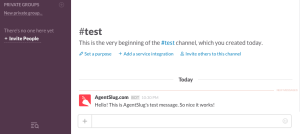 Right after you hit the “add” button we will send you a test message. If you got it, everything is done.