Category Archives: Upgrades

New server – New York

We have just deployed  a brand new uptime monitoring location – New York, US.

New server is powered by Digital Ocean.

In the nearest future we are going to open another location and after that, we will switch off the us.agentslug.com server (we have some problems with EC2).

You can always find a full AgentSlug’s uptime monitoring servers list here.


cover photo downloaded from Anders Jildén’s unsplash website which we truly love

Average response time per country and a couple of fixes

During the last weeks we have worked on a couple of minor changes you won’t see because most of them are under the hood or not released yet. However, two of the released ones are probably important to you.

Uptime chart - response timesAverage response time chart

This was something we were planning to do, but there was never enough time to make it done.

So we finally did it in the middle of our work for a major change of the whole downtime alert system (which is going to be released soon) to get a brake and freshen up our minds.

As you can see on the screenshot, we simply added additional data to the existing uptime chart. Those data represent the average response time for your website, grouped by country. You can find it on the test report page.

The blue line has not changed, it’s still an uptime percentage per day. The additional lines are yellow, red and orange. Those show the average response time per day for each country (US, FR and PL).

We also added a tooltip to each line to give you more detailed information about what you see on the screen.

This is the first version of this feature. We are going to enhance it in the nearest future.

No more e-mail flood

While working on the new e-mail notification system, we found out that sometimes something bad happens with our crawlers, and sometimes more than one robot grabs a tests to do an uptime check.

For some (thankfully) edge cases it caused more than one downtime alert.

The edge case was: the robots behave nastily and grab already reserved test to be checked and the website is actually down. Then, two or three robots detect this downtime, and all of them send the downtime notice.

This should not happen again, since we have finally found the real bug in our code.

Realtime uptime widget

If you’re our superuser you probably noticed you have an option to create a public page of your tests.

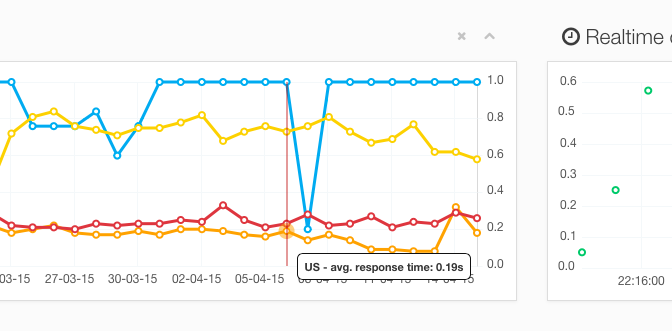
To make this functionality more interactive and custom, we created a possibility to add a widget wherever you want with the realtime uptime chart.

Adding a widget to your site is really simple, and if you have a opportunity to create a <script> tag to your website, you’ll definitely handle it without any problems.

Step 1 – create a public uptime monitoring page

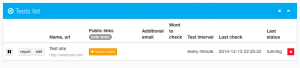
First thing you need to do is create a public uptime monitoring page. To do that, simply click on the yellow “create hash” button, next to a test name.

Create hash button

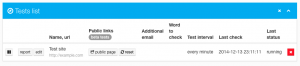
When you clicked the button, a new hash is created and now you have access to two different buttons: public page and reset.

Single test on list

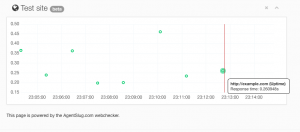
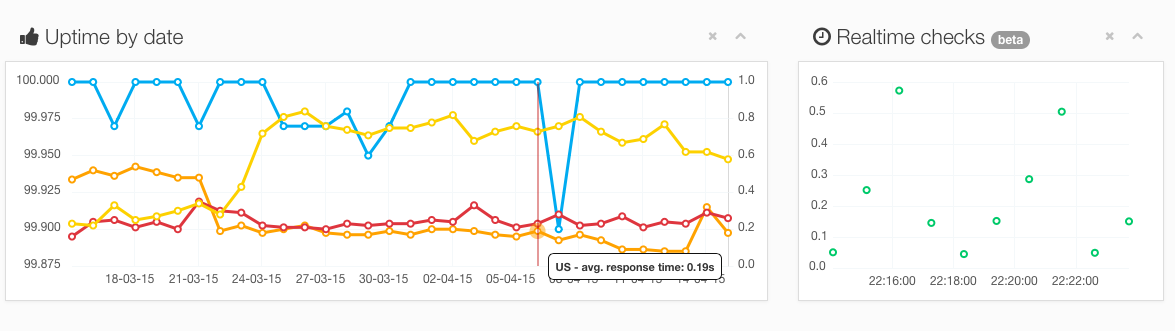
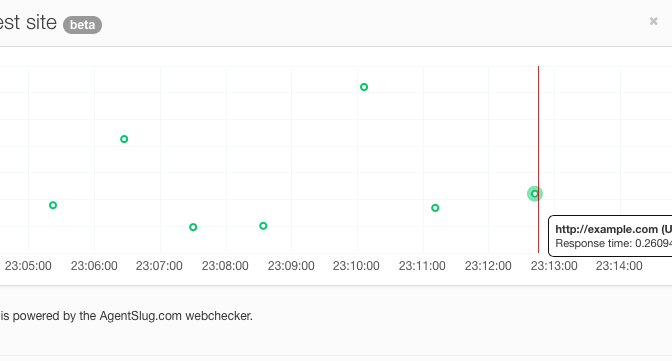
Public page is a public link with a realtime uptime monitoring chart. Anytime our robot access your site and report the uptime status, you’ll see a green dot on a chart.

If you hover the dot, you’ll also get an information about the single test proceeded

Realtime uptime monitoring - test site

Remember the page is as public in a same way as your dropbox share links. It is not protected by password or your account session. Anyone who knows the link, can access the site.

If you’d like change the link, you can always do that clicking the “reset” button on a tests list.

Step 2 – copy the secret part

Your new public realtime page URL looks similar to this one:

http://agentslug.com/public/realtime/d5ffc4218f/104

Now, write down (copy) two last parts of the URL. You’ll need it for widget configuration.

For this example, we need to copy this: “d5ffc4218f/104”

Step 3 – insert a <script> to your site.

Now it’s time for the last step. Simply copy the html below and paste it wherever you want (for example on you blog sidebar, just like we did here).

<div id=”uptime_graph” data-title=” ” data-hash=”d5ffc4218f/104″></div>
<script src=”http://agentslug.com/ps/realtime_widget.js” data-target=”uptime_graph”></script>

The only thing you need to customize to make it work for your test is to change the “data-hash” attribute. Paste there the two last one parts of the URL you copied on step 2.

You can also change the “data-title” attribute. If you leave it empty, there will be no title at all (just the chart and your logo), just like we did on this blog.

I’m a web developer, how to customize it

If you’re a web developer, you probably need to customize it.

You can do it both way:

By configuration

The script has basic configuration options. You can change the title (see above) and height of the iframe which displays the widget (default is 300px, max is 500px).

By making your own javascript

If you like to, you can always make your own script, using our as an example.

Source code of the script, extended information can be found on our GitHub repository.


Low account and zero account notifications tweak

Fresh, spring update

Tuning up the notifications

Recently we were working on another feature that may greatly improve your user experience with our service.

In order to meet your expectations, we’ve changed our low account and zero-account notifications.

How to disable notifications?

In fact it’s quite simple. You need to pause or delete all your active tests and then you’ll no longer receive any message.

Secondary email, quick settings link and more

New features you’ll love

Last couple of weeks we’ve been tuning up the AgentSlug.com to make it even better, faster and more reliable. We’re also preparing ourselves to do a big pivot of the app by adding some cool functionalities.

Aside of planning and wireframing the big v 2.0, we’ve already made some new features which seem to be a must-have as soon as possible.

All features listed below are available since today.

Secondary emails

After the upgrade, every website test (monitoring) can be labeled with additional, secondary (alternative) email.

When site is down (or up), AgentSlug.com will send a notification to the secondary email. Even if you set “email notifications” off in your account settings. Secondary email attribute is fully independent.

User story

I’m monitoring (personally) dozen of websites within AgentSlug.com uptime monitoring service. Not all of them are important to me nor my client. Some are just triggered to grab some data from the world.

For example, after we had deployed Ukraine-Russia cyber war monitoring I got flooded with up/down notifications from monitored websites. There were so many emails, that I was forced to turn the email notifications off to my whole account to not get flooded to death.

Now, with a secondary email feature, I still have email notifications turned off as a global setting. However, I set a secondary email to every important website.

Turn off email notifications within notification itself

If you’re a hardcore AgentSlug.com user, there is some probability that you get a lot of messages from the service.

Sometimes you’re aware of a problem with your site and don’t want to get more messages anymore.

Now, you can turn them off by clicking a “turn off” link. The link is valid up to two days and works even if you’re logged out.

Turning off the email alerts

Email notification turned off alert

Just in case you forget that you turned off email alerts, we will send you an email to remind you about that.

It would be sent no more often than once a month and only if one of your sites is down. If none of your site is down, you won’t get any message. Ever.